Архив торговых форекс стратегий

FxMen

VIP-участник
Fx Time Trading Action System
Является форекс торговой системой , которая предназначена для торговли в меньших временных рамках , как 1 минута, 5 минут, 15 минут, 30 минут и 60 минут.
 

Вложения

  • FX-Time-Trading-Action-Strategy.rar
    110,4 КБ · Просмотры: 738
  • fx-1.png
    fx-1.png
    30 КБ · Просмотры: 2 103
  • fx1-1.png
    fx1-1.png
    31 КБ · Просмотры: 1 580
  • fx2-1.png
    fx2-1.png
    34,4 КБ · Просмотры: 1 482
Последнее редактирование:

П123

Гуру форума
из буржуйского
ничего особенного.
но может кому что и найдётся для пользы профита
да же если запрячь в работу ТМА
 

Вложения

  • ТЕКСТ.jpg
    ТЕКСТ.jpg
    40,9 КБ · Просмотры: 1 055
  • 1.png
    1.png
    168,8 КБ · Просмотры: 2 514
  • Super Snake Trading.rar
    34,8 КБ · Просмотры: 589
Последнее редактирование:

П123

Гуру форума
ещё один самокат буржуинский

скальпинг в переводе дядигугельмэна

Сухого 5 пипсов скальпы является торговой системой, основанной на Бо канале Mika 's с быстрой целью прибыли. Это система тренд волатильности. Вы можете использовать эту систему двумя способами:
сначала с быстрым пт Например 4-5 пипсов EUR / USD или позиции выхода на противоположном сигнале.
Временные рамки 5 мин или выше.
Валютные пары для скальпинга: (EUR / USD, GBP / USD, USD / JPY USD / CAD.), Индексы (DAX и Dow).


Торговые сессии: Лондон и Нью-Йорк.
 

Вложения

  • Sukhoy 5 pips scalping.rar
    38,3 КБ · Просмотры: 976
  • sukhoy-scalping.png
    sukhoy-scalping.png
    139 КБ · Просмотры: 2 146

FxMen

VIP-участник
Forex Signal 30 Gold Edition
 

Вложения

  • Forex Signal 30 Gold Edition.zip
    41,5 КБ · Просмотры: 452
  • SoeHoeCom_g1.jpg
    SoeHoeCom_g1.jpg
    114,2 КБ · Просмотры: 2 257
  • SoeHoeCom_G2.jpg
    SoeHoeCom_G2.jpg
    97,8 КБ · Просмотры: 1 641
  • SoeHoeCom_G3.jpg
    SoeHoeCom_G3.jpg
    93,9 КБ · Просмотры: 1 283
Последнее редактирование:

FxMen

VIP-участник
Ловкость Heatmap - Brain Стимул для будущей торговли

AGILITY HEATMAP - BRAIN STIMULUS FOR FUTURE TRADING

This is an entirely new concept for future trading. The program resides outside MT4 and as such is free of the presentation constraints.

This is a dashboard which provides a dynamically updating heatmap over 14 currency pairs and 7 timeframes with the ability to place single click trades from the program complete with take profits and stop losses (nominated in pips).

Any heatmap button when pressed will open a full chart of the selected pair and timeframe. By clicking on any Currency Pair name and highlighting it, the pair (including commodities or shares) can be changed. After any change, just click on any adjacent input box to move the focus away from the current input.

The heatmap will update automatically whenever changes are made to any pair displayed.

This is only the tip of the iceberg and future revisions will include strategies, backtesting, portfolio management and trade performance meters. All ideas will be considered.

At this stage, I am open to suggestions as how to best trade with the heatmap and will implement autotrading once we have a collection of clear ideas.

INSTALLATION INSTRUCTIONS

Unzip the enclosed zip file.
Run MtApi.msi and accept the defaults (This is being missed by a few readers)
Copy MtApi.ex4 to the Experts directory
Place the MtApi.ex4 (Expert Advisor) on any chart in MT4 (You will need to be connected with your Broker).

AgilityHeatmap.exe, MtApi.dll and MTApiService.dll and should be placed together in any directory on your computer
To run - Create a shortcut to AgilityHeatmap.exe

The first time MT4 is run with MtApi installed, a firewall security notice will be displayed. Just allow the access to take place.
 

Вложения

  • 2016-05-10 23_23_37-MultiCharts.jpg
    2016-05-10 23_23_37-MultiCharts.jpg
    95,2 КБ · Просмотры: 994
  • 2016-05-26 14_00_35-MT4 - Microsoft Visual Basic 2010 Express.jpg
    2016-05-26 14_00_35-MT4 - Microsoft Visual Basic 2010 Express.jpg
    58,4 КБ · Просмотры: 770
  • 2016-05-10 23_07_14-MT4 (Running) - Microsoft Visual Basic 2010 Express.jpg
    2016-05-10 23_07_14-MT4 (Running) - Microsoft Visual Basic 2010 Express.jpg
    46,9 КБ · Просмотры: 597
  • AgilityHeatmap_Full_Installation.rar
    779,8 КБ · Просмотры: 349
  • HeatMapResources.png
    HeatMapResources.png
    92,8 КБ · Просмотры: 689
Последнее редактирование:

FxMen

VIP-участник
My trading system. It brings the average of 100 points per day.

If you are fond of the forex market for a long time but still have not found a profitable system, I want to share with you my trading system, by which I daily earn an average of 70-100 points net profit. I trade this system for 7 months. Automate completely objective system is not set, because I believe that in order to make a profit, you need to be as much as possible many of the trading terminal, especially at a time when you have open positions. You can not throw open positions and trust their robot. Robots can not take into account many critical factors in the market that often serves as a complete drain of deposits. To work with this trading system you do not need additional indicators or scripts. Only one GoodProf2016 and clear consistent implementation of my recommendations. In fact, the system is very simple and nothing complicated. It is semi-automatic, since all the signals when to open and close the deal you get. You just have to open and close in time order. Even in this system provides rapid response button. One Clieu You will be able to open and close the deal. By pressing a single button.

Trading Strategy.

Open a deal to BUY:
1. We expect when the chart appears blue arrow.
2. Look at the closing time of the bar. It is displayed at the top of the chart as a percentage.
3. As to the close of the bar is 2-5% - open the deal to buy.

Closing the deal on the BUY:
1. When the chart appears blue box - close the deal.

Open a deal to SELL:
1. Expect in the chart when there is a red arrow.
2. Look at the closing time of the bar. It is displayed at the top of the chart as a percentage.
3. As to the close of the bar is 2-5% - opening the deal to sell.

Closing the deal on SELL:
1. When the graph appears red square - close the deal.

This trading system brings a good profit on any currency pair already with the default settings, but you can choose your settings individually and increase profits.

In addition, you can turn signals via email or push in the trading system settings.

Here is a chart for 1 week testing the system:

Place the file in the trading system advisors and run it on a graph as an advisor.
 

Вложения

  • macross.png
    macross.png
    5,5 КБ · Просмотры: 1 167
  • GBPUSDH1__1.png
    GBPUSDH1__1.png
    68,1 КБ · Просмотры: 2 448
  • GoodProf2016.ex4
    68,5 КБ · Просмотры: 725

sam0709

Почетный гражданин
My trading system. It brings the average of 100 points per day.

If you are fond of the forex market for a long time but still have not found a profitable system, I want to share with you my trading system, by which I daily earn an average of 70-100 points net profit. I trade this system for 7 months. Automate completely objective system is not set, because I believe that in order to make a profit, you need to be as much as possible many of the trading terminal, especially at a time when you have open positions. You can not throw open positions and trust their robot. Robots can not take into account many critical factors in the market that often serves as a complete drain of deposits. To work with this trading system you do not need additional indicators or scripts. Only one GoodProf2016 and clear consistent implementation of my recommendations. In fact, the system is very simple and nothing complicated. It is semi-automatic, since all the signals when to open and close the deal you get. You just have to open and close in time order. Even in this system provides rapid response button. One Clieu You will be able to open and close the deal. By pressing a single button.

Trading Strategy.

Open a deal to BUY:
1. We expect when the chart appears blue arrow.
2. Look at the closing time of the bar. It is displayed at the top of the chart as a percentage.
3. As to the close of the bar is 2-5% - open the deal to buy.

Closing the deal on the BUY:
1. When the chart appears blue box - close the deal.

Open a deal to SELL:
1. Expect in the chart when there is a red arrow.
2. Look at the closing time of the bar. It is displayed at the top of the chart as a percentage.
3. As to the close of the bar is 2-5% - opening the deal to sell.

Closing the deal on SELL:
1. When the graph appears red square - close the deal.

This trading system brings a good profit on any currency pair already with the default settings, but you can choose your settings individually and increase profits.

In addition, you can turn signals via email or push in the trading system settings.

Here is a chart for 1 week testing the system:

Place the file in the trading system advisors and run it on a graph as an advisor.

Thank you very much! You Good Men!
 
Последнее редактирование:

FxMen

VIP-участник
Trade with 60
 

Вложения

  • GBPUSDH1.png
    GBPUSDH1.png
    90,9 КБ · Просмотры: 1 830
  • Как установить время и сдвиг по времени.png
    Как установить время и сдвиг по времени.png
    143,3 КБ · Просмотры: 1 648
  • Как установить время и сдвиг по времени..png
    Как установить время и сдвиг по времени..png
    146,7 КБ · Просмотры: 1 390
  • indies.rar
    36,7 КБ · Просмотры: 309
Последнее редактирование модератором:

FxMen

VIP-участник
Концепция золотого уровня

Концепция золотого уровня

Golden Zone Power Mining Indicator

The golden level concept was born from the quest to find only the most profitable and highest probability S/R (support/resistance) levels to trade from: Those that give us high reward for the least amount of risk. Accordingly, I open a thread a few month ago discussing this trading approach.
I am now releasing what I consider to be one of the most dynamic and advanced S/R level detection indicators so far on FF. It does not just generate levels defined by recent highs or lows but also across all time frames. The strongest levels tend to be those that are formed by the largest number of highs and low and are located deeply within price ranges. This indicator will find them for you.

For a tutorial on trading golden levels: _http://www.streamhedge.com/trading/forex/goldenlevels/ff2

This indicator is not only very powerful but also fun to use as you move the verticals lines and the S/R levels change in realtime. Chart and S/R (support/resistance) analysis becomes fun and is no longer a chore.

The Golden Level Miner will dig up S/R levels that would be hard to find with the naked eye. It will account for highs and lows that go back years (as far back as the data feed goes) or only those within the time frame determined by the vertical lines.

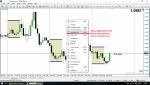
How to use the Golden Zone Power Miner

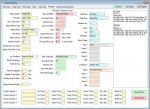
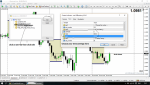
Approach #1 (long-term): The GL power miner will calculate levels from the highs and lows for each respective time frame by default. When you switch between the time frames it will regenerate the levels based on the new TFs highs and/or lows. Set DeleteLevelsOnTfChange to false if you want to keep the levels drawn as you switch between the TFs. This way you get to see which levels are the most significant as they are generated several times across several TFs and overlap, creating stronger price reaction zones.

After generating level on a particular TF. If you wanted to inspect the levels on a different time frame with having the indicator generator new levels on the TF you want to switch to, then set both DeleteLevelsOnTfChange and DeleteLevelsOnTfChange to false.

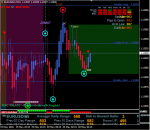
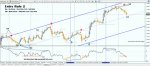
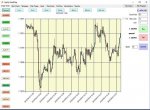
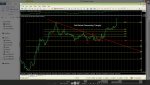
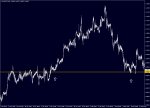
The following GBP/JPY chart shows golden levels generated by the H4 and the Daily TFs by setting DeleteLevelsOnTfChange to false and switching between them.
The indicator not only nailed several turning points that were worth 100s - 1000s of pips, but also revealed the zone that caused price to halt after the Brexit news.

Approach #2 (short-term): (The really fun one). Use one or two vertical lines to limit level mining to a specific time range. As you move them (one or both) across the time range you will see the most significant levels being generated in real time. If you only use one vertical line, the indicator will use the last (most recent) price bar as one of the starting points. This approach is particularly useful if you want reveal golden levels for a specific price range (using two vertical lines) or want to only get the most recent levels (using one vertical line). If you want to prevent the indicator from generating levels every time you switch between TFs, set DeleteLevelsOnTfChange to false. This is useful if you want to only generate levels by using vertical lines only so you can focus on specific ranges when searching for levels.

You always want to look for levels within ranges that price is about to approach. This is where approach #2 comes in. (If you wish, you can then confirm the strength of the level by switching TFs (approach #1) to see if the level also pops up on higher TFs and further back in time.) Approach #1 on its own will usually give you good scalp or swing trades.

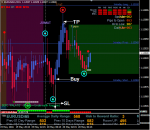
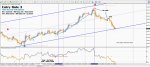
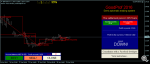
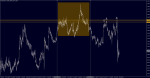
Take this example in EUR/USD: Price dropped outside of the range (golden box) and then turned back toward it. At what level within the range was price likely to bounce from (so we can take a short trade)? The indicator revealed the needed levels and offered us up to three potential entries.

The following video shows approach #2 in action on EUR/GBP. We draw two vertical lines around the price range that price is approaching and within which we can expect
a price reversal or at least a bounce. The indicator draws 5 levels, 4 of which are clustered close together and exist deep within the range at an excellent price to short from. Adding the trend line as a confluence factor gives all the reason to take a short from this zone.


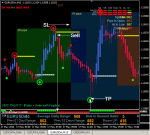
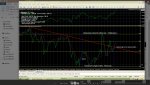
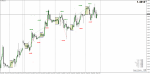
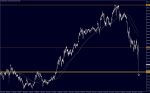
Another example on NZD/JPY. Note how price broke the red level (defined only by the ranges outermost lows) from which most traders would have taken the short, while the first set off golden levels is touched almost to the pip.


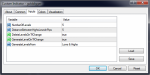
TIP #1: If you want to get an overview of where most golden levels are clustered, set the NumberOfLevels to a higher number. Note that with a higher number it will take some time to generate them on lower time frames as there are more highs and lows for the indicator to calculate.

TIP #2: You can always add your own horizontal levels on top of the generated golden levels. The levels you add manually will remain on the chart as you change the vertical lines and/or time frames and generated level get removed.

TIP #3: Since it can be time consuming to delete the individual levels that the indicator generates, download the Golden Level Remover to the MT4 script folder and set a hotkey combination (ex.: Ctrl+X) to efficiently remove all generated levels drawn on a given chart.


IMPORTANT: The golden power miner will dig up lots of nuggets and do the heavy lifting for you, but sometimes they need to be dusted off. Always verify that the levels match the definition of the golden level method and that there arent better levels nearby that the miner may have missed.
 

Вложения

  • Golden Level Trading.rar
    16,3 КБ · Просмотры: 632
  • gold_digger.png
    gold_digger.png
    108,2 КБ · Просмотры: 851
  • EURCHFM30-93aeb2e6466e4debe7a6994137852b38feefbeb78cb5c33dc1478add9d718e50.png
    EURCHFM30-93aeb2e6466e4debe7a6994137852b38feefbeb78cb5c33dc1478add9d718e50.png
    48,6 КБ · Просмотры: 1 156
  • EURUSDH4.png
    EURUSDH4.png
    104,4 КБ · Просмотры: 1 113
  • GBPJPYDaily.png
    GBPJPYDaily.png
    117,9 КБ · Просмотры: 972
Последнее редактирование модератором:

Dersu

Местный знаток
Не знаю что обьяснять
Может уровни дневные туда воткнуть
И тригер нормальный поставить
 

Вложения

  • Scalping Science.7z
    57,4 КБ · Просмотры: 399
Последнее редактирование:

dmitriypetrov

Элитный участник
НА счёт системы, работаю по такой

возможно это дополнит вашу систему ;) и других тоже , кому надоело СЛИВАТЬ :not-bad:
---
Индюк каналы channels.ex4
---
Советник помошник ProTrader


удобно строить каналы и отмечать дополнительные уровни
----
Автоматическая фибо сетка AUTO_FIBO_RETRA , чтоб знать где выйти , либо тейк держим до ближайшего уровня канала.
----
Выводит на екран сообщения если цена бьется в одну и туже точку (цену) AG v2.1 , по статистике если цена бьет в одну точку и не может пробить значит будет разворот (отбой) , это часто происходит возле уровней и внутри канала .
---
Индюк рисует уровни важные PowerDynamiteAreas-MTF + отмечаем свои (резкий отскок, флет (накопление) ,(как разметить смотрим видео)
---
Новостной индикатор Truly News Indicator 2.1.73 , торгуем только важные новости .
---
Скрипт Set2StopOrders для торговли по новостям , ставит два отложенных ордера бай сел
+ Видео , для понимания что происходит .o_o про уровни ,фигуры , каналы ,и другое
---
Немного о системе .....
Входить в начале месяца желательно , примерно с 2-4 торгуем по 27 число (остальные дни по статистике вялые ) , так как все тренды заграждаются в начале месяца , понедельники всегда игнорируем вялый рынок.
Стоп 30-50 пунктов , тейк плавающий минимум 200 , берем 1 к 5....20
Входить только на отбой от канала с 11-00 до 17 по Москве , длинные позы от 1 до 20 дней
На пробой работать с 8 до 11 короткие позы
Таймы H4-D1
По статистике отбой от канала происходит чаще , значит вывод .... работаем ТОЛЬКО НА ОТБОЙ , и торгуем важные уровни (пробой отбой ) ,про все остальное забываем .
Торгуем новости по индюку Truly News Indicator и скриптом-
 

Вложения

  • channels.ex4
    44,8 КБ · Просмотры: 274
  • MQL4.rar
    1,4 МБ · Просмотры: 376
  • ProTrader manual.pdf
    1,1 МБ · Просмотры: 405
  • AUTO_FIBO_RETRA.ex4
    4,9 КБ · Просмотры: 265
  • AG v2.1.ex4
    18,3 КБ · Просмотры: 269
  • PowerDynamiteAreas-MTF.ex4
    27,8 КБ · Просмотры: 268
  • Truly News Indicator 2.1.73.ex4
    100,6 КБ · Просмотры: 247
  • 12 видео , которые помогут стабильно зарабатывать.txt
    538 байт · Просмотры: 285
  • Set2StopOrders.mq4
    3,9 КБ · Просмотры: 218
  • ProTrader - Minimal.set
    4,8 КБ · Просмотры: 187
Последнее редактирование модератором:

Prelagatay

Местный житель
возможно это дополнит вашу систему ;) и других тоже , кому надоело СЛИВАТЬ :not-bad:

Индюк каналы channels.ex4

Советник помошник ProTrader _https://www.youtube.com/watch?v=SNJdyjjoHys

Автоматическая фибо сетка AUTO_FIBO_RETRA , чтоб знать где выйти , либо тейк держим до ближайшего уровня

Выводит на екран сообщения если цена бьется в одну и туже цену AG v2.1

Индюк рисует уровни важные PowerDynamiteAreas-MTF

Новостной индикатор Truly News Indicator 2.1.73
Скрипт Set2StopOrders для торговли по новостям , ставит два отложенных ордера бай сел
+ Видео , для понимания что происходит .o_o

Немного о системе .....
Стоп 30-50 пунктов , тейк плавающий минимум 200 , берем 1 к 5....20
Входить только на отбой от канала с 11-00 до 17 по Москве , длинные позы от 1 до 20 дней
На пробой работать с 8 до 11 короткие позы
Таймы H4-D1
По статистике отбой от канала происходит чаще , значит вывод .... работаем ТОЛЬКО НА ОТБОЙ , и торгуем важные уровни (пробой отбой ) ,про все остальное забываем .
Торгуем новости по индюку Truly News Indicator и скриптом
Спасибо, у меня уже есть вполне рабочий сов почти по этой системе и несколько разработок cmilliona которые меня устраивают.;)
 
Последнее редактирование модератором:
Верх