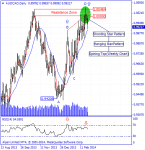
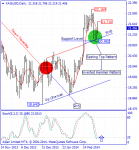
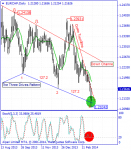
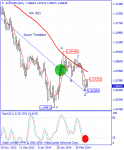
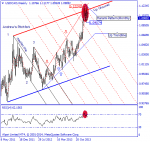
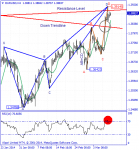
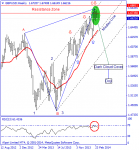
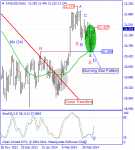
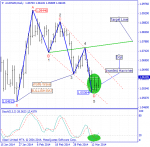
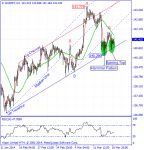
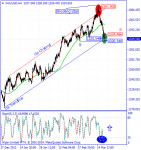
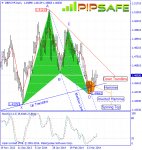
AUD/USD was in a strong and consistent downtrend during the recent months that sellers were successful in obtaining the lowest price of 0.86581. price with reaching to the supportive level which is shown in the picture below ( made of 2 bottom prices) has stopped from more descend( sellers used this level to exit their trades) and with formation of a bottom price in daily time frame has prepared a field for ascending of price.
With formation of Morning Star(with 2 stars) candlestick pattern in weekly time frame, there is a warning for Vulnerability of downtrend.Currently in weekly and daily time frames price is above 5-day moving average that warns about the potential of ascending of price during long period of time.RSI indicator in daily timeframe (also Weekly Time Frame) is in saturation sell area and also it is in divergence mode with the price chart that warns the potential for ascending of the price during the next candles.The first important warning for ascending of the price according to the technical signs is breaking of the resistance level 0.90481.

With formation of Morning Star(with 2 stars) candlestick pattern in weekly time frame, there is a warning for Vulnerability of downtrend.Currently in weekly and daily time frames price is above 5-day moving average that warns about the potential of ascending of price during long period of time.RSI indicator in daily timeframe (also Weekly Time Frame) is in saturation sell area and also it is in divergence mode with the price chart that warns the potential for ascending of the price during the next candles.The first important warning for ascending of the price according to the technical signs is breaking of the resistance level 0.90481.


