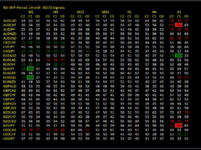
RSI Scanner.
1. You can enable/disable any time frame
2. You can set own RSI period ( default 14 )
3. You can set own Oversold/Overbought value ( default 30/70)
4. You can use own list of pairs or use default auto list.
if RSI value is crossing overbought/oversold area, RSI value will be marked with box.
it will show B or S depending on where RSI value is crossing.
It shows Candle C2,C1,C0 RSI values so you can read how it trends lately on each time frame.
if values are under oversold, it will be shown as green colored value
if values are above overbought, it will be shown as red colored value

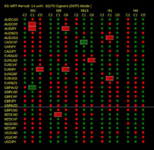
Default MODE is NUMBERS but you can change to DOTS in options.

once you set mode to DOTS, it will display trend as dots.
Where Green dot is uptrend ( means RSI is rising ), and Red dot is downtrend ( means RSI is falling)
Each C2,C1,C0 will compare value with previous bar and it will display dots accordingly.
Numeric value is only shown when RSI value is crossing oversold/overbought line which you can set in option.
example:
S68 means RSI value is falling and crossed from above 70 to below 70. Sell.
B32 means RSI value is rising and crossed from below 30 to above 30. Buy.

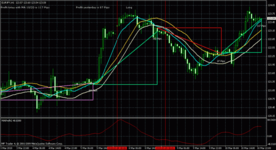
If you want both displayed at the same chart, you just have to drop two indicators but with own unique id.
example: unique Id for 2nd indicator set to 1.
Updated..
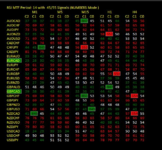
if all C0/latest bar RSI values for all time frame are overbought or oversold, it will display boxed symbol name with green - oversold, red - overbought.
But, it will be very rare to have all RSI value to be in overbought or oversold area if set to have 30/70.
example pic is for oversold / overbought as 45/55 for demo purpose


. Да и в инете тоже, одни картинки. У меня вопрос - кто-нибудь им интересовался? Как им работать? И можно ли им вообще работать? В тестере гонял, хотел понять логику работы, но вопросы все остались. Просто красивый мультик смотрел ))).
. Да и в инете тоже, одни картинки. У меня вопрос - кто-нибудь им интересовался? Как им работать? И можно ли им вообще работать? В тестере гонял, хотел понять логику работы, но вопросы все остались. Просто красивый мультик смотрел ))).
