- Форум
- Практический трейдинг: все, что нужно для торговли
- Автоматизация торгового процесса. MQL4
- Индикаторы форекс
Вы используете устаревший браузер. Этот и другие сайты могут отображаться в нем неправильно.
Необходимо обновить браузер или попробовать использовать другой.
Необходимо обновить браузер или попробовать использовать другой.
Karabas BARABAS
Директор Буратины
FX Tyrannosaurus
How to use it? Any rules please.
Is it repaint?
Tsar
Элитный участник
FX Tyrannosaurus
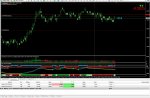
Make it... The SMA with CCI_FX Tyrannosaurus System

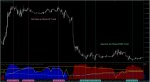
Added Multi SMA's time frime & CCI Custom Candles in Main Chart.
GREEN Line as Median Daily included Bolinger Band Shadow
Вложения
sbonch
Почетный гражданин
http://forexsystemsru.com/somnitel%60nye-predlozheniya-i-uslugi/77240-indikator-tochek-razvorota.htmlHow to use it? Any rules please.
Is it repaint?
Tsar
Элитный участник
How to use it? Any rules please.
Is it repaint?
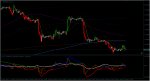
Hi Karabas BARABAS,
Just backtesting in 2 Days. I didn't found Re-paint,
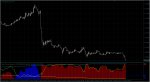
FX Tyrannosaurus indie based Stoch modification make rather difficult knowing the certainty.
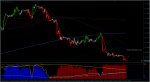
As I know... Bar in Histo likely Signal Trend and Volume. And Yellow line Dynamic's as Stoch line ( not Price Trend )
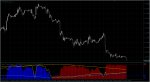
Use this Strategy, when RED Bar Histo's must Sell Position & when BLUE Bar Histo's as Follow the Trend.
And the Climax Trend is Touch @ Level 20% or Level 80% (must be like Picture) Still Learn about 2 Lines ; Aqua and Yellow (another) function.
I like Combine with Another Indicators in my Post #3865
Вложения
Tsar
Элитный участник
I cannot understand when to buy or sell! What are the rules for this system?
The first... You must know how Bolinger Band theory and work.
!@BySu-Fx KGMA ALL PERIOD 2015 indie made from Programmer in my Country, affialate with KG (Kang Gun Group)
They have another Theory for made the Indicator, based Time Frime Calculation.
They have another Theory for made the Indicator, based Time Frime Calculation.
My System recommend use M5 ; M15 ; M30 (most Populer used KG Group) and H1 for INTRADAY (If you use H4 or above TF will found another MA Lines)
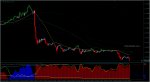
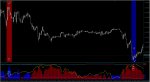
GREEN Line (with Bolinger Band Shadow) as Median Line.
If Candle in position BELOW GREEN Line, always take Sell (b'cause Seller more Stronger than Buyer) More Over Yellow Line in Below Green line and Blue Line in Below Yellow line mean Strongest Bearish Trend.
If Candle in position ABOVE GREEN Line, always take Buy (b'cause Buyer more Srtronger than Seller) More Over Yellow Line in above Green line and Blue Line in above Blue Line mean Strongest Bullish Trend.
And CCI Custom Candle as Guidance Signal for Trigger when Candle touch / near the Line
NOTE :
You never found the Perfect MA Line worked like these...
Последнее редактирование:
Норм
VIP-участник
За этими индюками перерисовки не замечал...
#Chaos Oscillator точно рисует 3-4 свечи. Я уж обрадовался, неужели что-то путевое сделал кто-то после ССI и QQE...
GreekForexTrader
Интересующийся
The first... You must know how Bolinger Band theory and work.
!@BySu-Fx KGMA ALL PERIOD 2015 indie made from Programmer in my Country, affialate with KG (Kang Gun Group)
They have another Theory for made the Indicator, based Time Frime Calculation.
My System recommend use M5 ; M15 ; M30 (most Populer used KG Group) and H1 for INTRADAY (If you use H4 or above TF will found another MA Lines)
GREEN Line (with Bolinger Band Shadow) as Median Line.
If Candle in position BELOW GREEN Line, always take Sell (b'cause Seller more Stronger than Buyer) More Over Yellow Line in Below Green line and Blue Line in Below Yellow line mean Strongest Bearish Trend.
If Candle in position ABOVE GREEN Line, always take Buy (b'cause Buyer more Srtronger than Seller) More Over Yellow Line in above Green line and Blue Line in above Blue Line mean Strongest Bullish Trend.
And CCI Custom Candle as Guidance Signal for Trigger when Candle touch / near the Line
NOTE :
You never found the Perfect MA Line worked like these...
Can you share the indicator for the pink and aqua lines you provide in your screenshot?
Karabas BARABAS
Директор Буратины
Can you share the indicator for the pink and aqua lines you provide in your screenshot?
This lines was make by hands, not by indicator
Karabas BARABAS
Директор Буратины
вроде тут чел продает его за 100 баксов, что случилось? почему в свободном доступе? или как и все - гуано ?
Tsar
Элитный участник
Umm... I forgot it :facepalm:
For to know Target TP (Take Profit) need Another Indicator like Fibonacci, Pivot Point or something else in Main Chart. These use for Confirm with FX Tyrannosaurus indie.
Maybe... you like use Auto Fibonacci MTF [Muti Time Frime] Post #126 or AllPivots_v3.8 Post #127
Or Another your familiar Indicator used
The first... You must know how Bolinger Band theory and work.
!@BySu-Fx KGMA ALL PERIOD 2015 indie made from Programmer in my Country, affialate with KG (Kang Gun Group)
They have another Theory for made the Indicator, based Time Frime Calculation.
My System recommend use M5 ; M15 ; M30 (most Populer used KG Group) and H1 for INTRADAY (If you use H4 or above TF will found another MA Lines)
GREEN Line (with Bolinger Band Shadow) as Median Line.
If Candle in position BELOW GREEN Line, always take Sell (b'cause Seller more Stronger than Buyer) More Over Yellow Line in Below Green line and Blue Line in Below Yellow line mean Strongest Bearish Trend.
If Candle in position ABOVE GREEN Line, always take Buy (b'cause Buyer more Srtronger than Seller) More Over Yellow Line in above Green line and Blue Line in above Blue Line mean Strongest Bullish Trend.
And CCI Custom Candle as Guidance Signal for Trigger when Candle touch / near the Line
NOTE :
You never found the Perfect MA Line worked like these...
Hi Karabas BARABAS,
Just backtesting in 2 Days. I didn't found Re-paint,
FX Tyrannosaurus indie based Stoch modification make rather difficult knowing the certainty.
As I know... Bar in Histo likely Signal Trend and Volume. And Yellow line Dynamic's as Stoch line ( not Price Trend )
Use this Strategy, when RED Bar Histo's must Sell Position & when BLUE Bar Histo's as Follow the Trend.
And the Climax Trend is Touch @ Level 20% or Level 80% (must be like Picture) Still Learn about 2 Lines ; Aqua and Yellow (another) function.
I like Combine with Another Indicators in my Post #3865
Последнее редактирование:
Норм
VIP-участник
Да в складчину приобрели, но плохо устанавливается и работать некомфортно, к тому же проще свое сделать, а заработать по этом завру также непросто как по простым индюкам в МТ4.вроде тут чел продает его за 100 баксов, что случилось? почему в свободном доступе? или как и все - гуано ?
Tsar
Элитный участник
Dear All,
Looking for AO_Zotik 8.1 and WPR_filled
Kindly like to Share, please... :my-heart:
Looking for AO_Zotik 8.1 and WPR_filled
Kindly like to Share, please... :my-heart:
Вложения
Последнее редактирование:
Где сами индикаторы?Dear All,
Looking for AO_Zotik 8.1 and WPR_filled
Kindly like to Share, please... :my-heart:
Tsar
Элитный участник
Где сами индикаторы?
_http://ruforum.mt5.com/threads/9219-indikatori-ao-zotik-wpr-vsmark/page11
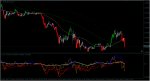
As the Green Lantern where is the Market moves :macho:
I've AO_Zotik_8.0 indie as the previous, it's Good and No Re-paint. But Not Custom Indicator.
Need AO_Zotik 8.1 I wish Custom included...
I've AO_Zotik_8.0 indie as the previous, it's Good and No Re-paint. But Not Custom Indicator.
Need AO_Zotik 8.1 I wish Custom included...
Вложения
Последнее редактирование:

Alex M
Местный знаток
Господа трейдеры!, гляньте набор индикаторов на систему тянет - нет?
Привет.
Скрин выложи - так быстрее ответят, захламлять терминал многим нехочется.
Господа трейдеры!, гляньте набор индикаторов на систему тянет - нет?
шаблон какой то кривой без индикаторов!
oliva1
Элитный участник
Вторая попытка.шаблон какой то кривой без индикаторов!