Архив индикаторов

ИванМН

Местный знаток
Уважаемые выкладывающие, спасибо за ваш труд, но есть две небольшие просьбы:

- когда вы выкладываете несколько индикаторов и, соответственно, на скриншоте у вас также несколько индикаторов, то, пожалуйста, подписывайте на скрине, где какой. В посте № 6777 зелёный канал - это какой индюк?

- пишите хотя бы пару слов, чисто как вы сами видите: как надо применять тот или иной индюк, что считать сигналом - стрелку, положение линий, вывод алёрта, значение из "Окна Данных"... Это далеко не всегда очевидно.

Заранее благодарен.
 

erex

Элитный участник
Если бибифлэт с драконом не рисуют... Хотя... Рисуют, конечно )))
ДРАКОН - художник (вот бы убрать у него сглаживание). Биби, вроде, нет.
У дракончика еще и стрелки косые. Фу!
1695137954670.png
 
Последнее редактирование:

Bullra

Новичок
TSI (True Strength Index)

eurusd-h1-roboforex-ltd.png
 

Вложения

  • tsi_1.mq4
    3,4 КБ · Просмотры: 86

FxMen

VIP-участник
CZI.jpg

It's a well-known fact that most of the financial markets trend only 30% of the time while moving in a closed range rest 70% of the time. However, most beginner traders find it difficult to see whether the markets are trending or stuck in a range.

KT Chop Zone solves this problem by explicitly highlighting the market phase into three zones as Bearish Zone, Bullish Zone, and Chop Zone.

Особенности​

  • Instantly improve your trading by avoiding trade during the sideways market (Chop Zone).
  • You can also use it to get exit signals. For example, you may exit from a long trade when it enters into a Chop zone.
  • Fully compatible with Expert Advisors. You can easily import this indicator in your expert advisor and improve your trading strategies.
  • All Metatrader alerts included.

Входные данные​

  • Main Period: An integer for the oscillator. We recommend putting a value between 10 to 30.
  • Bullish Zone Level: Choose a level for the bullish zone.
  • Bearish Zone Level: Choose a level for the bearish zone.
  • Color Settings
  • Alert Settings
 

Вложения

  • KTCZI.jpg
    KTCZI.jpg
    178,3 КБ · Просмотры: 569
  • KT-Chop-Zone-Indicator.ex4
    15,6 КБ · Просмотры: 137

vaas04

$$$$$$$$$
Вот оригинал, не такой красивый но то же самое. Возьми настройки с красивого. Правда не пойму на скрине явный сливатор, нафиг он нужен в такой форме.
 

Вложения

  • AUDUSD.mmH1.png
    AUDUSD.mmH1.png
    32,8 КБ · Просмотры: 488
  • sve_bollinger_band.mq4
    9,8 КБ · Просмотры: 64

Nobodys Hero

Активный участник
Интересный индикатор, но идея не нова и описана еще в 2010 году. В следующей своей статье автор изложил основные принципы ТС на основе этого индикатора. На мой взгляд вполне очевидные ...

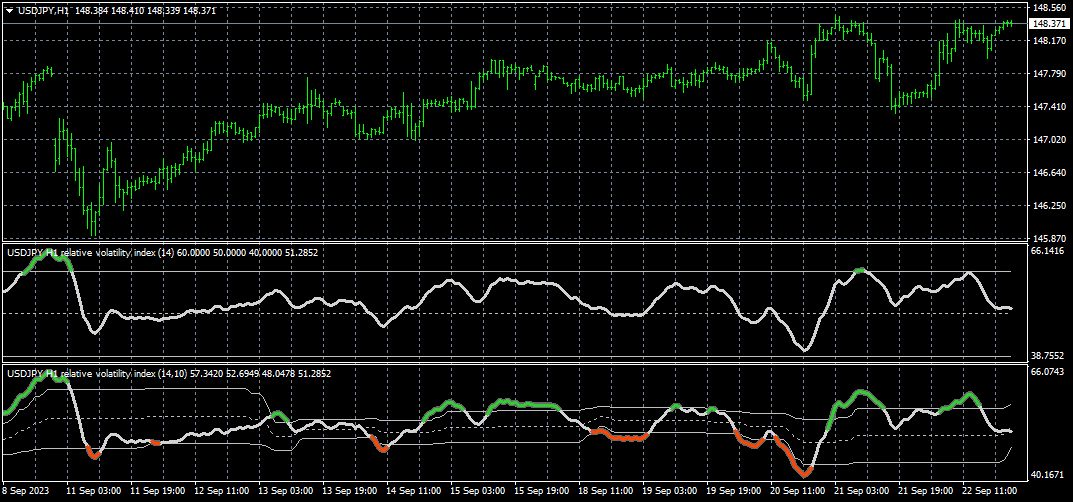
Often, the Sve_BB%b is a leading indicator making smooth moves with clear turning points. Normal and hidden divergent moves make it an ideal tool to help find entry and exit points while watching price moving between the Bollinger bands. In my last article, I looked at how this indicator could help traders identify entry and exit points while prices are moving between the bands. This time, I will introduce a good trading system using the Sve_BB%b and include some ideas together with other technical analysis tools. There are some tricks that could help traders get started:

1. Use a candlestick chart when applying the Sve_BB%b. This is because candlesticks tell you more. You will look for candlestick reversal patterns to get a confirmation of a possible turnaround.
2. Use the most basic tools like support, resistance, and trendlines. Knowing that the Sve_BB%b is a leading indicator, you will just use the turning points of the indicator above and below the active standard deviation reference levels as a signal to start drawing a trendline and not as a signal for a direct buy or sell.
3. Keep a close eye on convergent and divergent moves between price and indicator. Ideally, you would open or close a position after a standard positive or negative divergent move. The bottoms or tops of this divergence are preferably spaced closer together than the price move before the divergence because price correction waves are generally moving faster than price trend waves. Look for hidden divergences and interpret them as a possible continuation of the previous up- or downtrend.
4. Use 20-, 50-, and 200-day simple moving averages. Use the 20-day simple moving average as an aid to draw trendlines with the short-term price move. Use the 50- and 200-day simple moving averages as dynamic support and resistance levels.
5. Use a fast-responding trailing stop to get in and out of a trade. A good example would be one like my Tr&nds trailing stop introduced in the July 2009 issue of Stocks & Commodities. Use this stop as a warning signal. Look closely at the evolution of price at that moment in time. This trailing stop is considered broken only if crossed by the high price.
6. Always take care of the risk-to-reward ratio before entering a trade.
 

Вложения

  • SVE Bollinger Bands Article - Smoothing The Bollinger %B by Sylvain Vervoort.pdf
    795,4 КБ · Просмотры: 41

Bullra

Новичок
Grucha_percentage_Index_V2

eurusd-h1-roboforex-ltd.png
 

Вложения

  • Grucha_percentage_Index_V2.mq4
    6,1 КБ · Просмотры: 57

Bullra

Новичок
Relative volatility index

Relative volatility index 1.1

usdjpy-h1-tickmill-ltd.png
 

Вложения

  • Relative volatility index 1.1.mq4
    13,4 КБ · Просмотры: 34
  • Relative volatility index.mq4
    12,9 КБ · Просмотры: 26

botanist2

Новичок форума
Всем привет. Может знает кто, почему изменился внешний вид файлов mg4. После того как скачал скрипт с форума началась такая петрушка. И как это можно исправить?
 

Вложения

  • Screenshot_3.png
    Screenshot_3.png
    2,5 КБ · Просмотры: 40

botanist2

Новичок форума
В
В редакторе он нормально и будет , ты же ему только внешний вид поменял а не формат.
А можно редактор отдельно установить?
редакторе он нормально и будет , ты же ему только внешний вид поменял а не
 
Верх