Technical analysis of Gold dated 29.12.2014
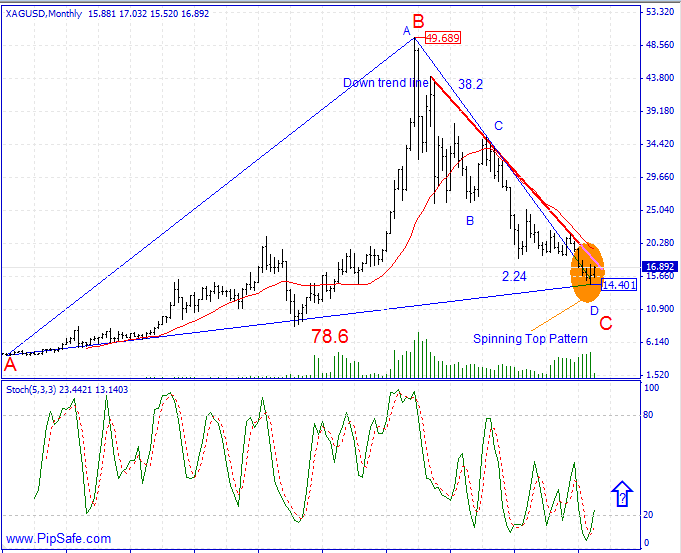
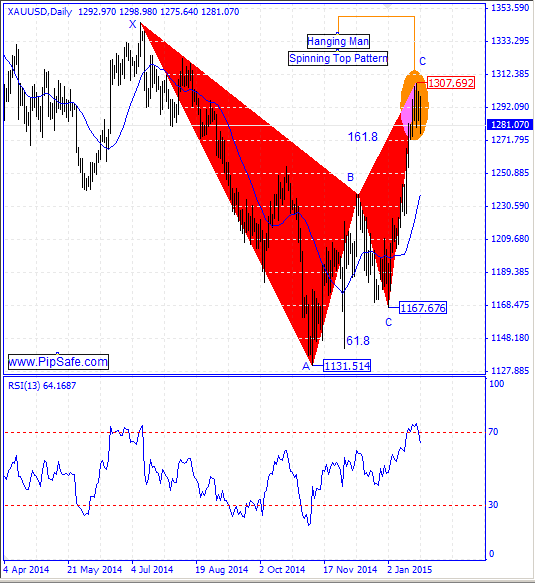
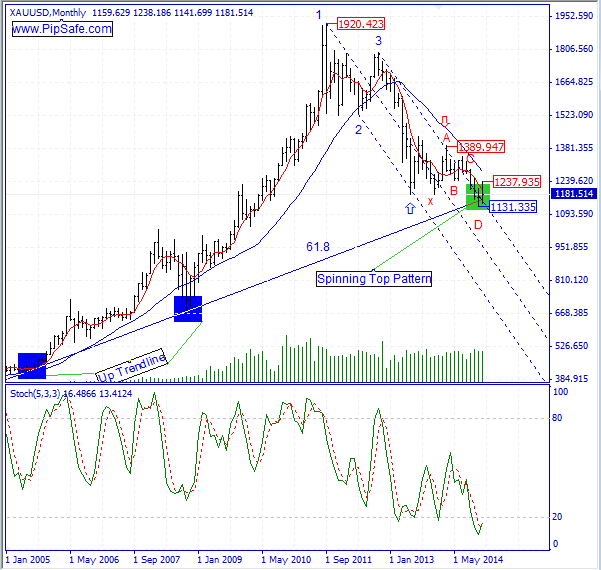
Price since the end of 2011 till now was in strong and consistent downtrend with a little price reformation and sellers were successful in achieving the lowest price of 1131.335.Price has formed a bottom price(Spinning Top Pattern) with reaching to the specified supportive levels(Up Trendline and d point of harmonic pattern) in the picture below and it has stopped from more descend and has started a little ascend with shows exit of some sellers from their trades.
As it is obvious in the picture below, there is a harmonic butterfly pattern between the bottom price of 1131.335 and the top price of 1389.947 that there is a potential for changing price direction from D point of this pattern.Stoch indicator in Monthly time frame (also in daily time frame) is in saturation sell area and with the next cycle warns about ascending of price during the next candles.Generally until the third point of Up Trendline is preserved, the price has the potential for ascend and reformation in this Metal.