Я не просто так сказал, что нужно изучить всю ветку. Вы ответили на первый вопрос, но думаете человек что-то понял? Где эта ветка? Если написать, что на красном, будет вопрос - где это. В этой ветке Пензер (Нуф) все объяснял, поэтому и надо ее всю изучать. Кстати, вот по ген-корр файлик.Всем здравствуйте. Коллеги, с прошедшими праздниками нас))
Sedov-o, спору нет, если человек захочет действительно научиться торговать , то он просто обязан углубленно изучить данную ветку, и еще некоторые дельные форумы, но... кто из нас, не имея Учителей, потратил уйму времени пока до него стали доходить определенные вещи? Очень понравилось выражение "Необъятная"))
Конечно веселит, когда чел приходит на ветку с требованием -эй, вы тут быстренько меня научите, как бабло рубить, денег быстрых хочется))), но Morozz zikk не пришел на ветку с вышеупомянутым требованием, а задал конкретные вопросы, на которые есть конкретные ответы ( это тоже самое, если я подойду на улице к челу с вопросом "подскажите, пож-та, который час, а меня отправят на Красную площадь посмотреть на часы на Спасской башне))
Итак, выражения у Пензера еще те, но кто знает его дольше - привыкли))
1. Ген - кор - есть ветка Торговля от коррекции- всё гениальное просто (там же правило четырех)
2. Чукгек ляндия - не подскажу, может быть из ветки + 5 пунктов в каждой сделке, но мне инфа того форума не пригодилась в торговле, а значит свою голову забивать лишним не буду.
3. Свой-чужой - это работа с зиг-загом или светоформ, или светиками (их кодовое название)) Сначала рисуется большой светофор, затем малый и еще один малый. Вот их С.А., а до него, по-моему, Нуф (он же Пензер, он же и т.д.))) назвал Свой-Чужой. Параметры светофора (это индикатор) можно выставлять любые 233-34-12 или 120-12-12. Это уж как Вы успеете за ценой бежать, кто-то без светиков работает, каждый рабочее поле под себя строит.
Вот как-то так... На конкретный вопрос - такой-же ответ.
Торговая стратегия Haos-visual +ssrc_mtf: пипсовка для всех.
- Автор темы grekoveugene
- Дата начала
А сразу слабо было человеку файлик прикрепить?))) Если чел не дурак, а это видимо так, если три года изучает рынок и еще не убежал с него, то гуглом пользоваться может и ветку Торговля от коррекции- всё гениальное просто найдет. Это раз. Я ответила на все его три вопроса. Это два. И третье - не цепляйтесь к девушке. Мужчину это не красит)
Даже в мыслях не было к Вам цеплятьсяА сразу слабо было человеку файлик прикрепить?))) Если чел не дурак, а это видимо так, если три года изучает рынок и еще не убежал с него, то гуглом пользоваться может и ветку Торговля от коррекции- всё гениальное просто найдет. Это раз. Я ответила на все его три вопроса. Это два. И третье - не цепляйтесь к девушке. Мужчину это не красит)
Morozz_zikk
Прохожий
Ребят, спасибо за понимание и подсказки! Ветку изучаю, много для себя нового беру и немного погружаюсь в слэнг (Пензер очень интересно пишет, приятно читать))) Хочу поблагодарить за такое количество дельной информации. Через недельку скорректирую свою ТС, если все пойдет хорошо, обязательно поделюсь.
Соратники!
У кого в загашничке остался СКРИПТ что выкладывал Platoon.
Смысл скрипта-ставим его сначало на Н1 и смотрим уровни,а затем на М5 по ним орентиримся.
Жутко приятно получается по этой Почти Граалю от Платону иметь своё с хаоса.
С новым форумов архив ветки недоступен,а в архивы домашние,мне доступа нет.

На мт5-форуме в ветке где Пензер караулить с подсказа Виктора М свои законно,что нам должны хаосом...20п 4зн профита.
Соратник Хантер-V выложил чюдесную гонялочку форекса в ларёк за долей нашей с хаоса в виде пучка зелени.
Немного в архив скинул.
Но в реал-времени,лучше смотреть оригинал
Соратник Генри,если что не сердитесь..немного напомнил ,Ваши наработки,что чють раньше выложены на этой ветке.


Соратник Хантер-V выложил чюдесную гонялочку форекса в ларёк за долей нашей с хаоса в виде пучка зелени.
Немного в архив скинул.
Но в реал-времени,лучше смотреть оригинал
Соратник Генри,если что не сердитесь..немного напомнил ,Ваши наработки,что чють раньше выложены на этой ветке.


Вложения
Сам я как получается по времени,смотрю свою гонялочку по Ао по старинке
На М1
поставил МА или с М5 или даже лучше с М15 и тормоз зигзаги...таким же соответом.
в подвал АО от М1 до Н1..прям прелесть и радость лентяя.
Свои 10п 4зн как с куста,конечно если не торопится куст трясти .
Все входы смотрю ТОЛЬКО по прямому пересеку МА(тут ген-корр вам в подмогу)
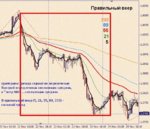
примерно так
На М1
поставил МА или с М5 или даже лучше с М15 и тормоз зигзаги...таким же соответом.
в подвал АО от М1 до Н1..прям прелесть и радость лентяя.
Свои 10п 4зн как с куста,конечно если не торопится куст трясти .
Все входы смотрю ТОЛЬКО по прямому пересеку МА(тут ген-корр вам в подмогу)
примерно так
Вложения
Смотрю так
Выбираю мтф ао с которого беру главный сигнал-тренд рабочий именно для сигнальных моментов ао М1.
и тогда при положении ранжиром МАшек становится просто и легко на душе,от того что жабулька не ноет под ухом
А довольная урчмит,пересчитывая профит.
Так как с времением у Пензера засада..мало его для торчания возле моника...надо успеть в розарии почюдить...то тока на европу,строго как закроется аазия что перекрёстно попадает и до открытия чикага,а там час после открытия чикаго и дальше,пока не опухнещь от профита.
В принципе,как порой мне говорит племянница...СВОИ 5п 4зн в сессию не взять ...надо быть не глупым,а банальным глупышкой.
Но это не критерий,делай как я..это просто имхо.
Каждый сам враг своему депозиту и сам,только сам должен провести коллоквиум...где ваш изюм договорится с вашей жабулькой-КАК обувать хаос!!!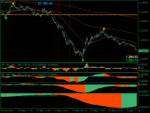

Вложения
Genry_05
Отдыхает
Пензеру - мое почтение! Не розарием единым … хорошо что не забываете и нас и темуСоратник Генри,если что не сердитесь..немного напомнил ,Ваши наработки,что чють раньше выложены на этой ветке.
На ФФ Cfudge изложил свой взгляд на %R в теме "Consecutive Candles Williams %R and Volume with 55EMA Baseline". А неплохо у него получилось - народ куёт 20п легко и не парится. И я сегодня запустил его ТС и тоже 20... потом добавил своего изюма и им в теме отписал как и что.
В прицепе авторский вариант. Форум теперь не позволяет грузить .tpl, так что добавил ему расширение .txt
------------------------
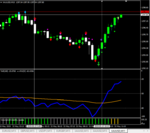
Система состоит из индикатора "consecutive candles 1_02.mq4" и еще двух для подтверждения сигнала :
Williams' Percent Range и VolumeAndVolatility update
Описание:
1. условия для начала торговли создаются когда Williams %R входит в экстремальные зоны выше уровня -20 или ниже -80.
2. после этого ждем сигнала индикатора "consecutive candles": нам нужно дождаться появление стрелки, а затем подтверждающей
стрелку точки в нужном направлении (если мы находимся выше линии -80, мы ищем стрелку вниз, ниже линии -20 мы ищем стрелку вверх). Bar c точкой желательно с более низким/высоким закрытием, чем бар со стрелкой.
Для того, чтобы это был действительный сигнал, нам нужно исполнение еще трех условий:
1 Williams %R, должен выйти из экстремальной зоны - пересечь уровни вниз от -20 или вверх от -80 .
2 Williams %R, чтобы быть ниже 55ema (установлен на First indicator's data %R) для продажи или выше 55ema для покупки.
3 Volume/volatility индикатор должен быть желтый или зеленый (если серый - нет торговли).
Если все вышеперечисленное будет выполнено, мы сможем торговать в нужном направлении.
Вложения
Последнее редактирование:
Genry_05
Отдыхает
Форум теперь не позволяет грузить .tpl, так что добавил ему расширение .txt Надо переименовать файл - убрать расширение .txt чтобы имя было williams2.tpl
Genry_05
Отдыхает
Я торговал сегодня что попало - где %R заскочил в зону -20 -80 там и ожидал исполнения всех правил, пары брал где спред поменьше.Ого. Какой форум стал .(((
Я правильно понял этот метод больше для Золота ??Спасибо .
Автор пишет что хорошо торгуются металлы и некоторые кроссы, по мне - все торгуется. Но я добавил асимметричный фрактал и Киосотто в помощь индикаторам автора.
Вложения
Последнее редактирование:
Genry_05
Отдыхает
m15 - как рекомендовал автор.
----------- Про фрактал и Киосотто я им отписал вот этот текст (думаю переводчик легко переведет его обратно)
To improve the forecast, you can use the statistical advantage. This approach is used in the indicator "consecutive candles" which checks two candles to search for price impulses in the direction of %R, but how effective is it? To answer this question, check with what probability the reversal occurs after X-consecutive candles in one direction. As a result, we will get more reliable settings for candle filtering.
According to the results of the analysis, you can set up an indicator of the type “asymmetric fractal” in which the left shoulder will contain the number of bar after which the turn is most often, and the right shoulder will be short - 1 candle (this will be its delay).
Here are the results of statistical analysis for a pair of EurUSD m15 on the interval of 10 years:
========== M15 from 01.01.2009 - 01.02.2019
EURUSD,M15: Closing percentage with price increase 12 candles - 83.33%
EURUSD,M15: Closing percentage with price increase 11 candles - 70%
EURUSD,M15: Closing percentage with price increase 10 candles - 67.74%
EURUSD,M15: Closing percentage with price increase 9 candles - 62.5%
EURUSD,M15: Closing percentage with price increase 8 candles - 60.05%
EURUSD,M15: Closing percentage with price increase 7 candles - 57.73%
EURUSD,M15: Closing percentage with price increase 6 candles - 56.73%
EURUSD,M15: Closing percentage with price increase 5 candles - 56.17%
EURUSD,M15: Closing percentage with price increase 4 candles - 55.36%
EURUSD,M15: Closing percentage with price increase 3 candles - 55.02%
EURUSD,M15: Closing percentage with price increase 2 candles - 54.17%
EURUSD,M15: Closing percentage with price increase 1 candle - 53.04%
It is clearly seen that the largest number of successful turns occurs after 11-12 consecutively growing candles. So we can adjust the fractal indicator with the left shoulder equal to 11-12 bar + extremum + 1 bar - the right shoulder (confirmation of the extremum).
Asymmetric fractal indicator in trailer. It does not best fit this method, but gives an idea of the work of the statistical advantage.
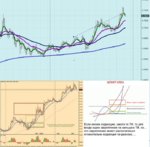
An example of filtering for Gold according to data from Euro on the screen - fractals are marked with rhombuses.
On screenshots are three orders for Gold today. At the top, the SL trawl worked, the lower ones were without a trawl.
--------------
Quoting aaven: {quote} Genry, Can you kindly show how the indicator increases the odds of better entry. Thanks
Пояснение к центральному скрину из поста выше. For the first order entry condition was:
1. %R in oversold area
2. "VolumeAndVolatility update" - green
3. wlxFractals previously painted a reversing rhombus
4. "consecutive candles 1_02" drew an arrow with a dot
5. if we take the Kiosotto signals into account (third screen), then the histogram level is above two thresholds: 15 and 21.
The second order by the usual rules. Второй ордер был открыт по правилам автора.
Последнее редактирование:
Не этот ли ищете?Соратники!
У кого в загашничке остался СКРИПТ что выкладывал Platoon.
Смысл скрипта-ставим его сначало на Н1 и смотрим уровни,а затем на М5 по ним орентиримся.
Жутко приятно получается по этой Почти Граалю от Платону иметь своё с хаоса.
С новым форумов архив ветки недоступен,а в архивы домашние,мне доступа нет.Посмотреть вложение 330225
Вложения
dwarfrost
Новичок форума
Соратники!
У кого в загашничке остался СКРИПТ что выкладывал Platoon.
Смысл скрипта-ставим его сначало на Н1 и смотрим уровни,а затем на М5 по ним орентиримся.
Жутко приятно получается по этой Почти Граалю от Платону иметь своё с хаоса.
Привет!
Вот такой есть скрипт уровней от Platoon...
И в приложении ещё его описание, тоже Platoon писал
Вложения
А подтверждающая точка обязательно должна быть после стрелки или разрешается точка вместе со стрелкой?Пензеру - мое почтение! Не розарием единым … хорошо что не забываете и нас и тему
На ФФ Cfudge изложил свой взгляд на %R в теме "Consecutive Candles Williams %R and Volume with 55EMA Baseline". А неплохо у него получилось - народ куёт 20п легко и не парится. И я сегодня запустил его ТС и тоже 20... потом добавил своего изюма и им в теме отписал как и что.
В прицепе авторский вариант. Форум теперь не позволяет грузить .tpl, так что добавил ему расширение .txt
------------------------
Система состоит из индикатора "consecutive candles 1_02.mq4" и еще двух для подтверждения сигнала :
Williams' Percent Range и VolumeAndVolatility update
Описание:
1. условия для начала торговли создаются когда Williams %R входит в экстремальные зоны выше уровня -20 или ниже -80.
2. после этого ждем сигнала индикатора "consecutive candles": нам нужно дождаться появление стрелки, а затем подтверждающей
стрелку точки в нужном направлении (если мы находимся выше линии -80, мы ищем стрелку вниз, ниже линии -20 мы ищем стрелку вверх). Bar c точкой желательно с более низким/высоким закрытием, чем бар со стрелкой.
Для того, чтобы это был действительный сигнал, нам нужно исполнение еще трех условий:
1 Williams %R, должен выйти из экстремальной зоны - пересечь уровни вниз от -20 или вверх от -80 .
2 Williams %R, чтобы быть ниже 55ema (установлен на First indicator's data %R) для продажи или выше 55ema для покупки.
3 Volume/volatility индикатор должен быть желтый или зеленый (если серый - нет торговли).
Если все вышеперечисленное будет выполнено, мы сможем торговать в нужном направлении.
Genry_05
Отдыхает
Автор написал так: Then we need the indi. to print a candle with a dot (preferably with a lower/higher close than arrow candle). Тогда нам нужно чтобы индикатор напечатал свечу с точкой (желательно с закрытием ниже / выше, чем свеча со стрелкой).А подтверждающая точка обязательно должна быть после стрелки или разрешается точка вместе со стрелкой?
Т.е. Желательно, но не обязательно
wlxFractals. Если он рисует ромб, а потом consecutive candles рисует стрелку или стрелку с точкой я считаю что вершина подтверждена и смотрю следующее правило - чтобы VolumeAndVolatility был желтого или зеленого цвета - это у меня первый ордер.
Для еще большей надежности можно поставить Киосотто и если его гистограмма на ромбике Фрактала пробила уровень 12-14 или уже за 20, то это еще одно подтверждение что экстремум состоялся.
Бывает и вторая вершина (второй фрактал), но просадки были небольшими и счет не успевал расстроиться и впасть в состояние депрессии (может я мало торгую этот метод и не успел повидать настоящей просадки). В английском тексте этот момент я объясняю так: To improve the forecast, you can use the statistical advantage. This approach is used in the indicator "consecutive candles" which checks two candles to search for price impulses in the direction of %R, but how effective is it? Т.е. индикатор автора "consecutive candles" проверяет 2 рядом стоящие свечи для отрисовки стрелки-точки, а у меня Фрактал настроен на проверку 8-14 свечей (по результатам статанализа). Так что на стрелки-точки consecutive candles можно вообще забить, а можно уважить и дождаться их после ромбика Фрактала. Можно два ордера поставить по мере подтверждения сигнала.
А когда сработают правила автора:
%R выйдет из экстремальной зоны + %R пересекает ЕМА55 в обратную сторону + VolumeAndVolatility желтого или зеленого цвета - можно открыть еще ордер как положено по системе Автора.
Последнее редактирование:
А можно Ваш шаблон?Автор написал так: Then we need the indi. to print a candle with a dot (preferably with a lower/higher close than arrow candle). Тогда нам нужно чтобы индикатор напечатал свечу с точкой (желательно с закрытием ниже / выше, чем свеча со стрелкой).
Т.е. Желательно, но не обязательно, а чтобы было надежнее я добавил
wlxFractals. Если он рисует ромб, а потом consecutive candles рисует стрелку или стрелку с точкой я считаю что вершина подтверждена и смотрю следующее правило - чтобы VolumeAndVolatility был желтого или зеленого цвета - это у меня первый ордер.
А когда сработают правила автора:
%R выйдет из экстремальной зоны + %R пересекает ЕМА55 в обратную сторону + VolumeAndVolatility желтого или зеленого цвета - я ставлю второй ордер как положено по системе Автора.
 | Получайте подарки за сделки от брокера NPBFXТоргуйте и получайте дополнительную выгоду: от новейшего смартфона до премиум автомобиля! |
 | Время доверить трейдинг роботам!Настоящее и будущее трейдинга – это робоэдвайзинг! Попробуйте наших лучших роботов бесплатно! |
 | Копируйте сделки успешных трейдеров!В самой умной платформе для автоматического копирования сделок NPB Invest (NEFTEPROMBANK Invest) |
Посмотрели (236) Посмотреть
- witek33
- savage123
- Олег7524
- YetAnotherFX
- Imil555
- kwatuhit
- stef30003
- спутник
- sergok
- ХитрыйЖук
- ATAT
- Gral77
- Vladimir_1985
- lex123123
- ILIA3000
- gverhey3
- @ndre1ka
- leon74
- S777
- Gannhilo
- ruudik
- bevakasha
- hlopez
- Murena
- Дмитрий1233
- SanCheiser
- dens37
- mercyr
- snegko1971
- 5161elias
- Serega 12
- datamind
- antony1402
- Илон
- ДЕНГА
- Goddess
- j644719356
- Gnom_
- prikolist
- dadafor006
- Allice
- Veteran52
- shapick88
- Thunder61
- v2812
- Сидоrов
- tana808
- Dilkon
- vitas334
- nayilz
- Alukard777
- sergey76363
- KMS USN
- vzulaks
- MakcG
- многоножка
- krasin174
- 89029106383
- Maxxxxx
- Slim303
- Heyuen7
- cinniri
- саша23-67
- ezreal
- wokn
- uzinterello
- pawn
- kyza
- erichzahn
- kapil777
- Sv148
- kingoo11
- Al0878
- forexpipind
- smel
- josekawa
- dmr139
- Lysenko
- nox73732
- BenChaouki
- Andrey211976
- alenabigmoney8
- petrofih53
- funnybro
- cvtifhbr
- daniel j
- oded
- Max313
- antiadam1
- shahram
- basha
- Дмитрий99
- nikson84
- kink
- alifhadson
- siri86
- bkmz_84
- DamirJUM
- MITYA77
- Jarhead
- Igorek1977
- prokop2013
- ViliasFog
- massimo197652
- forexryk
- don888
- Tankk
- balaji_forex
- Ivan056
- tamaska
- Billonairegidd
- kkk kkk
- yutopupo
- FxMen
- HYDRA6
- sibire
- Dits
- Alexost
- Алексей1231
- mrthe
- aleksey65
- agentpro1
- GIN1
- Colins
- Sergey Panin
- mosnfet
- oli
- rasvet01
- александр_80
- vadimыч
- pahom55
- pchela1956
- andbav
- SergMedwedev
- svetpav
- safarov
- Hellded13
- uriy74mag
- Farron
- alexxxmuha
- pavelisa
- Alex55i
- ksudon
- abderrahim chs
- chris123444
- anurag
- Vladimirjurav
- xoranob2023
- Rinochka
- AsKui
- Zharlam
- vika1007
- Gryg
- Nikola_ic
- alcidescas
- nurfirdaus
- gukk
- gabi2025
- Dexterous
- Sparhok
- Billy Kid
- arry
- avgust
- Andrey228304
- Darho
- RAZDERBAN
- Lan Franco Mari
- razvan
- clever66
- Dvoeknet
- maramebara2
- TradersMamba
- Мурад_
- Def Leppard
- Astarlook
- Demogar
- wenhsiang112
- digal
- Brooklyn1979
- Evasparkling
- WinBaks
- dxmt
- Yurij.Shev
- loki177
- Kochegar
- alex5338
- vicin
- vova8782
- uaehawx
- sedov-o
- MERFY
- Vitali_55
- dwarfrost
- RamikFX
- adamk1017
- Jakeokd
- rezaika
- Jedi Master
- devoss
- makeymk
- achir254
- sacredx
- master1979
- Steelwar
- alessandro.ian
- regdes
- Djsergdk
- serg2135
- Genry_05
- svet2989
- maxs2002
- erex
- Viktor73
- consul
- alet23
- mayskii
- Dmitry81
- sapp
- cooc
- Дмитрий Кузьмин
- SANNY2
- Kamvel
- el_Venso
- Ranko
- arnauld
- Dewa Aja
- qwerty79
- Servaz_57
- Ildar1
- oksan4ik74
- ertman
- Shmmer
- BTR300
- Gorvm_kon
- njkjkjn
Отслеживают (471) Посмотреть
- *__StalKer__*
- -=Читер=-
- ...zefirka...
- 1010
- 10999
- 1ALEX1
- 4irik
- 555е
- 666спутник
- 89268187555@bk
- 9serg
- A.S.V.
- a2a2a2a2a2
- aaa777
- abuu
- abwal
- Adler 88
- admini lohi
- adres13
- Aeros12
- ailyin
- aka487
- akss9
- ALAN-78
- Ale-xander
- aleks3003
- Aleksandr2020
- alex.sis
- alex1959
- alex2506
- Alex6
- Alexandrus
- alexccs3
- Alexer1
- AlexIva
- AlexK1
- AleXXX34
- ALEX_SPB
- Alexаndr
- Ali-77
- Alsizan
- Alterwest
- amcat79
- andreo525
- andrius34
- Anna20
- Anshegar
- Anton Gerasiv
- antoxa4m
- Areke
- arevo
- arhont
- artembgs
- artmovs
- ARTOPED
- Asam77
- asan_master
- asdasdasd23rsd
- asdek_com
- Aspart
- AssaAE
- ausi
- AVOKent
- AVR77
- AVTOLIDER
- AxelP
- B.ASAD
- Babushka1
- bafet
- Balda80L
- Baldis
- Bankrotstedy
- Barny
- barok
- BEGO866
- Belizas
- benefit1
- berk
- Bhackta
- bjaa
- calipsol
- casper_
- cheZz
- CIZ
- ckc
- Clair
- conada
- Crosh
- cuufoj
- d3f
- Dalgo
- DamirJUM
- DangerTrade
- deadm
- DeD66
- dema1
- Demi
- Demoschet
- denis87
- DenisViskov
- DenyDe77
- Deputat73
- Dexterous
- dgtl
- DIAS
- dim777777
- dima_o
- Dimdimich
- dimmon28
- DIMon1973
- DimonL
- diyor
- DKU
- dmOor
- DN78
- dodox
- dollarmy
- Dolphin
- DOPLER
- dragons76
- drtit
- Dukascash
- EgorD
- Elderdick
- EnRon
- everton13
- Evgeno1984
- EVGENYI
- extreme911
- falhtke
- fantom3x
- Filin
- filinn64
- Firstzz
- FLAME
- fluda4ka
- foma123
- ForexON
- forex_neforex
- Fractlr
- fx-reaper
- FXiding
- FxMen
- fxtrade@.ru
- fyner
- Gamzan777
- gelo100
- Gena Ishivatov
- Genri Krok
- gh68
- Goddess
- goluver
- Gonzik_G
- Gorodilov A
- grekoveugene
- GRiNGA
- Gucul79
- haba-h
- habaha
- Harison
- hasany
- hiken
- hopeless9
- HYDRA6
- Hyrurg
- ig@r
- Igor1985
- igor_leonov
- Ildar1
- ilkinn
- imm
- IntraDayScalping
- IRIP
- ISPANEZ
- Ivan056
- jacik
- jager
- jcz
- jdi
- JoeyParry
- josephines
- jund
- jura2904
- jurax1984
- kab1973
- kaktys77
- kalak1995
- Kamvel
- kanvas
- Kataklysm
- Kaza_n
- Khagan
- KHURUMAIR
- king
- kinginfo
- kipjatok001
- kirill_81
- kohar
- KOKO 2010
- kokoneo
- krakodil
- KriKs-Fx
- kruglev
- krul
- kwatuhit
- lambert1970
- Leif57
- Letnabong
- leto33
- lexflyx
- liber1
- liberty
- limelight
- limonn
- Limuzin
- loower
- lotte
- loveful
- luckash
- Luna001
- Maglav
- mailonline
- Major1607
- mangold
- mangust
- Marat456
- marek111
- marsel0109
- MarshaCip
- martinluter2014
- Masdem
- Masix
- Masterprofi
- Matthewson
- mavitime
- MaxSmith
- meblivsim
- merka
- metal1964
- Mihal1
- Mikhail777
- mironof
- mironrzg
- MishaLaz
- Morozz_zikk
- MrLerich
- mserega74
- nalic
- nastyaozr
- Nencko_chan
- NEV72
- niclag
- nidhogg
- niknelid
- nipigaz
- nitar
- nnld218
- NOKIA
- nord badger
- nordx
- NUF
- NutBoot
- OAN777
- oddron
- oleg1343
- oleg2185
- Oleg59
- olegkom
- olgert
- olivermolden
- omg
- Palladium
- Pammexpert
- Paradis
- Partizan161
- PartnerF
- Patrick Olsthoorn
- pavarottin
- Permmyak
- petro_gr81
- Pilygrim
- pk9999
- po77itiff
- politehnik
- psihodelit
- puzan
- qwe_7
- radeon25
- Ramboo
- ran78
- ranger308
- Ranko
- rastaroot
- redneedle
- Regwall
- reteid2222
- rkkgs
- robert.smith
- roddy321
- RoninGT
- RRA1978
- rublevskiy1
- Ruckus
- ruslan970
- S D V
- Sabon
- safal
- sam0709
- Sam163
- Sanara
- sanfic
- sans12
- sansany4
- SanyaVS
- Sanz
- Sap
- SAS75
- saw
- sdqrsm
- sedeur
- sedov-o
- semenwm
- serega11rus
- Serg-Kamensk
- Serg79
- SergeiB
- SergeSPb
- Sergey85
- SergeyKhl
- sergio2015
- sergmika
- sergo58
- serjik777777
- serrus
- shapoval
- shawls
- Shmmer
- sibire
- sirius13
- skripach
- slastV
- Slavyan2777
- Slimka
- slo
- snegsv
- Sokolov
- stasonik42
- stef30003
- Stimul173
- Strict
- sunny.kumar.sp
- suvenir-rus
- svan567
- svet2989
- t.kosmos
- tana808
- tatmet
- teapeak
- Tedbear
- Teos Raa
- Tepih
- tex2611
- teyket
- thvi
- tiger1968
- trance2008
- trusov
- Truthly
- trydiaga
- Tujh371
- Uliana
- upvtku
- uzinterello
- Vaadi
- vadimыч
- VaheV
- val4443
- Valecastro
- Valeron
- valseva
- valzevs
- vampir7777
- VanLee9666
- vasilichzwz123
- Vasiliy Sol
- vera_vota
- victarius
- Viktor25771
- Viktor395
- viktor5021
- VirusCz
- vitalij bogush90
- Vitali_Leto
- vitas334
- Vitek555
- Vito Andolini
- vlad5530
- vladimir876
- vladislavian
- VLV
- voks8844
- Volody_lt
- vugar1981
- vvs439
- w2m
- warwick
- Werner34
- wladi2000
- Wladimirowih
- xabar77
- xlev777
- XPEH
- yarborg
- youlik
- Yusufiy
- Zarden777
- ZIKILO
- zmmailer
- zorgo
- zpro
- zzz-7
- [Anatoliy]
- _Viy_
- ___*Human*___
- Алекс Дюбуа
- Андрей 1983
- Андрей Строгонов
- Андрейка3737
- Ардашер
- Арсений88
- Большой Ос
- БЫК
- Вад64
- ВАРТКЕС
- ВладZV
- Влд
- ДимДимыч
- Зеленый трейдер
- Игорь Александрович
- Канифоль
- Кенто
- Крис Белый
- лимо
- Максим555
- Мария2
- Марс
- мизер
- наиль
- Новiчок
- Одинева
- Ольга92
- Охотник19
- поручик
- РАШИД АНАСОВ
- Рина
- ринат666
- руслан42
- Саня1984
- Сервик
- Сергей Р
- Синица
- СоmраS
- Софи
- специалист
- спутник
- старый хохмач
- Трактор
- Тяпляпыч
- хомка
- ЮНГ
- Яна Боцман


