Вы используете устаревший браузер. Этот и другие сайты могут отображаться в нем неправильно.
Необходимо обновить браузер или попробовать использовать другой.
Необходимо обновить браузер или попробовать использовать другой.
From bear1 easy buy and sell signals.
- Автор темы bear1
- Дата начала
bear1
Активный участник
Bist100 index still sell signal.
Especially medium term systems are in sales signal.
For bist100 index my target is around 107.000
good luck.
ON BIST100 LOWEST INDEX PRICE 106400
bear1
Активный участник
Bist100'de kısa vadeli dip rakamı 97.800 dür.
1-2 haftalık silkelemeden sonra ilk etapta tekrar 116.000 civarı test edilecek bana göre.
Detaylı yorumu hafta sonu yapacağım.
***********************************
Short-term bottom figure in bist100 is 97.800.
1-2 weeks after the fluctuation of the first stage again 116.000 to be tested for me.
I'il make a detailed comment this weekend.
All the best
bear1
Активный участник
Support, resistance
*****************
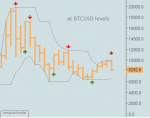
Regulatory support resistance is determined by zigzag ind. First, the weekly chart opens. Then zigzag ind. is added to the chart. Zigzag is added to the lowest or highest level of the breaking bar from left to right. Like the example. This is the most convenient and method of determining the resistance to the rule of support. All other methods are wrong. That's the main task of the zizag indicator.
bear1
Активный участник
I very very thank you dear garry119
Your system seems very good. Really, A great system.
Последнее редактирование:
I very very thank you dear garry119
Your system seems very good. Really, A great system.
Hello, bear1. Share your indicators, please


