Hi
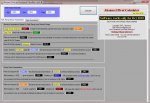
I am doing calculation based on High=1.3983,Low=1.3833,Close=1.3935 ;
It would be better you give your idea and let me see . if need correction then I would correct you.
Anyway,
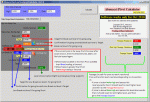
1-Daily power Sentiment is lower than Close of the day means the price is already situated in Bullish area.
if price falls and can pass again this level then we will have a signal to target=1.3992.
2-Daily -Monthly mixed pivot =1.3933 . This level is very important . It should not be broken . If broken then gives a signal toward pullback signal . The main duty of this point is to indicate a level to show strength of the trend . If in Asian session and before UK session , this level is not broken , then a big movement and very trendy day is expected . If this point is broken toward downside and tends to be sold , this level should not be broken again. Several breaking of this level will show a choppy , sloppy none trending day (Like Friday market Oct 8)
This level is introduced by Abonacci system for the first time and can not be found in other softwares or formulas.
3-Temporary Direction=1.3912 . This point shows market will move toward this point in the Asia session .
4-pullback =1.3904 . This is the level that may cause the market to be pulled back . As Diversion point= 1.3894 is below that point it is showing a support for pullback level. So its a good level to buy and put stop loss 10-15 pips below diversion level .
5-The distance between pullback level and tendency toward level(1.3891) is not so much and this means a bullish reversal.
6- 1.3945 is the level that indicates if the market tends to be sold and can break pullback signal , then should not rise and break this level . In case of breaking , gives a bullish signal .
7-The distance between close and keypoint @1.4094 is more than 159 pips . This indicates a big bullish pressure should be exerted to get to this level. Not so much of sloppy market will be expected for tomorrow.
Кто внятно переведет это все.
По данным на понедельник привожу уровни на 18 как описал автор и как я поняла....
H - 1,4158 L - 1.3936 C -1.3976
вводим данные в калькулятор, получаем значения
1 - Daily power Sentiment ниже чем закрытие дня, значит цена уже в бычьей области. Если цена упадет и вернется через этот уровень, то мы будем иметь сигнал на бай с целью на 1,4021.
2 - Daily -Monthly mixed pivot -1,3968 7не должен быть пройден, если цена закроется ниже него мы получаем сигнал к откату pullback на 1,3943 с поддержкой на 1,3942. Если после отката цена закроется выше 1,3988, то это будет сигналом к бычьему движению.....
Temporary Direction=1,3984(временное направление). Этот пункт показывает рынок будет двигаться к этой точке в сессии Азии.
Если я правильно это понимаю.


