Вы используете устаревший браузер. Этот и другие сайты могут отображаться в нем неправильно.
Необходимо обновить браузер или попробовать использовать другой.
Необходимо обновить браузер или попробовать использовать другой.
Сборник систем XARD777.
- Автор темы rambul
- Дата начала
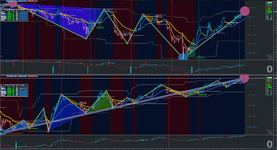
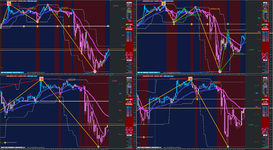
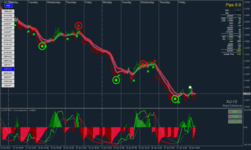
подвал рисует?FX4 STD+DASHПосмотреть вложение 427715
сергей1131
VIP-участник
Чтобы все не лопатить, напиши пож.название подвального индюка.подвал рисует?
eduard9898
Новичок форума
FxMen
VIP-участник
Update
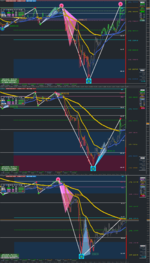
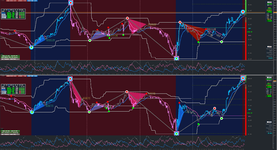
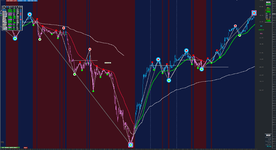
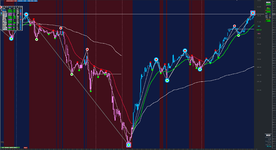
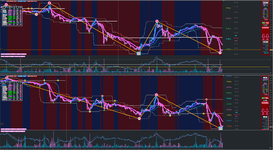
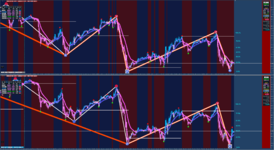
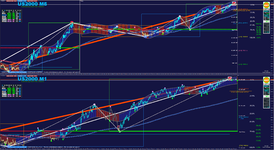
XARDWORLD rev009 for everyone's perusal.
It includes a simple expert for BUY/SELL and CLOSE of trades.
The Expert wont work with MTF indys (such as DASH) so don't use them (it's an MT4 quirk).
You can set the TradedLots calculation from within the Expert input menu.
It is defaulted as 5'000 so you should be able to take trades without breaking the bank.
If too high, set TradedLots to 2'500, if too low, set TradedLots to 7'500.
MMATH settings are in sync from H4 all the way down to M5
The Trend Line is set off H1 so it is in sync all the way down to M5.
If you are trading on a M15 TF then you are already trading off the H1 Trend line.
In this version M1 TF is NOT catered for (due to lag time on crappy computers) or maybe you wish to remote trade your PC using your phones web browser and Guacamole on Windows or Linux.
A couple of things that you want to watch for...
1) The change of the Trend line (the background will change as well).
2) Price coming off the Daily open line - watch the right panel colors.
3) The Bias off the Pink Perdot (the Orange ZZ line matches this).
And lastly, keep a watchful eye on possible Golden Nugget moves (i.e. Red Dot Below the Open line & Green Dot Above the open line).
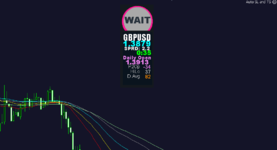
Added feature:- The panel on the right changes color...
Above the Open line and greater +10% ADR RoyalBlue color
Above the Open line and less +10% ADR DarkGreen color,
Below the Open line and less -10% ADR Violet color,
Below the Open line and greater -10% ADR Crimson color.
NB If you only display one chart on your screen, remove BORDERS indicator from the list and save your template.
I also added some extra indicators for you to try out that are not included with the template file.
They are CCI TREND rev007 and HLC Trend(alerts) rev001


Вложения
FxMen
VIP-участник
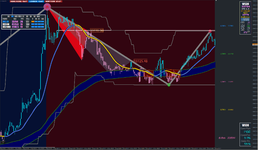
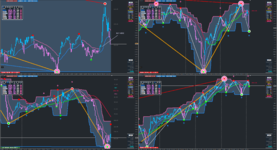
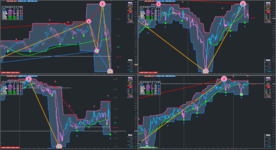
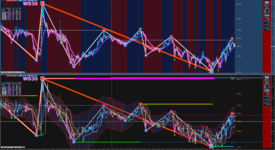
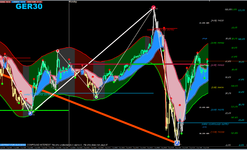
Latest Update XU v32
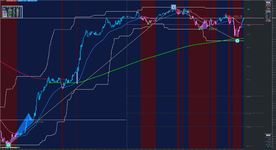
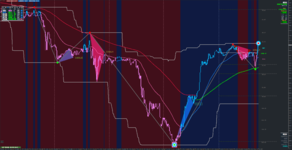
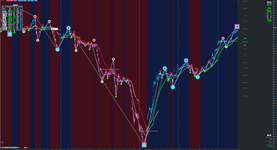
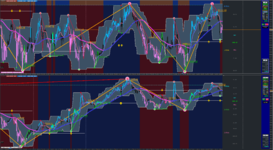
The number one rule in the Market is when Price is Above the 200SMA to consider BUYING opportunities only and when Price is Below the 200SMA to consider SELLING opportunities only. This is the Industry Standard, so it makes sense to work off it and show it on the setup.
In the latest update, I decided to set the T2MA to 200SMA (Industry Standard).
As for the T1MA setting, I changed the T1MA to 42EMA as in “Life, the Universe, and Everything” which is forty-two (Hitchhikers Guide to the Galaxy). Works a charm.
So T2MA = 200SMA and T1MA = 42EMA.
Anyway, I tried it and the small Semafor tends to bounce off it just nice. Plus when you are trading you have the added knowledge when Price is Above/Below the 200SMA. How cool is that?
Regarding the RSi, I have added a simple RSI-coloured text (top-right of sub-window) showing when the RSI is above (Blue) trending UP, below (Red) trending down, and (Grey) in between.
I have dropped the ZZ1 Orange line in this setup as I feel it is not needed and is just overkill. We still have the Square Semafor in play.
This is my final setup which I have refined over the years to its original Simple Trend Following System to use when intra-day trading the markets.
May it be your roadmap and help you with your Directional trading and make you a boatload of Pip$ along the way.
There is no better feeling than being your own boss booking 50%, 60%, 70%, and 80% on a daily basis.
With Pip$ comes freedom and a whole lot more...
Enjoy!
