Разметки по различным инструментам

  • Автор темы Автор темы Юрий FT
  • Дата начала Дата начала
Статус
Закрыто для дальнейших ответов.

MDunleavy

Активный участник
Канадский доллар может снизиться в районн 1,0080 и в дальнейшем консолидироваться в указанном на рисунке диапазоне.
~~~~~~~~~~~~~~~~~~~
--USD/CAD: Our core bullish outlook for this market has been more than reaffirmed over the past couple of weeks, with the market accelerating back above parity and towards 1.0500 thus far.
--While we continue to project significant upside over the medium-term, risks over the short-term appear to be tilted to the downside so that the market can correct from overbought readings on the daily chart.
--However, any setbacks should now be very well supported ahead of parity and in the 1.0100 area.[dailyfx]
3.png
 
Последнее редактирование модератором:

MDunleavy

Активный участник
--Думаю не выбрала ещё нефть до конца своего падения и возможно опустится ещё ниже где-то в район 74-75 долларов ...
--События развивались классически цена достигла линии поддержки и преодолела её, опустившись до 81 доллара. Сейчас формирует треугольник, который может быть реализован последующим движением вниз в указанный выше диапазон 74-75 долларов....
=============================================
---Crude Oil Weekly P&F Technical Outlook.
...Crude Oil Maintains The Upside Bias.OPEC decision was so helpful for crude pushing it up to the top of the range that is expected to remain among it $80-$85, as the commodity is trading now around $84.66. But how long the upside momentum will last as the Greek elections at the door and no one knows how results will come. In fact, central bankers seem to be more mature than the market speculated before, as they stand ready to stabilize financial markets in a coordinated action to provide liquidity if the Greek elections on Sunday cause a mess in the market....[by oilngold]
05.png
 
Последнее редактирование модератором:

MDunleavy

Активный участник
--The USD/JPY pair shot straight up during the week as the dollar found its footing against most currencies for the week.
--The 80 handle continues to be the epicenter of resistance for our money, and has still price down.
--The level won’t be considered broken out of it until we cross and close above the 80.50 level.
--This area is a clear top to the resistance area on the daily charts.
--Because of this, we are not ready to go along yet but believe that a break of the top of this week’s candle would be an excellent buy signal.
--As for selling, we are looking to do that now. [By FX Empire Analyst]
1.png
 
Последнее редактирование модератором:

MDunleavy

Активный участник
The Dollar Index (DXY), which Intercontinental Exchange Inc. uses to track the greenback against the currencies of six major U.S. trade partners including the euro and the yen, advanced 2 percent, the most since December, to 83.285. It touched 83.431, the highest level since June 1.
==================================
Dollar Index [DXY]: This forum had the conviction to be a $ bull for the last 1 year or so when all expert commentary was bearish on the currency. The buck hasn’t disappointed by its performance either, having rallied from 73.26 in May 2011 to a close of 82.9420 last week, just under its previous high at 83.6700. Can the $ rally higher?
1.png
 
Последнее редактирование модератором:

MDunleavy

Активный участник
На протяжении длительного периода времени пара евро \ американский доллар движется в горизонтальном направлении ширина канала в пределах 24,5% _https://lh6.googleusercontent.com/-otROYzcCHGU/UAPZoQt1_fI/AAAAAAAAAX0/De4_Uymw6K0/s1597/031.png KapTuHKа
Пара снижается в пределах 90 дней. Что довольно долго и по всей видимости дальнейшего снижения и пробоя многолетней линии поддержки не последует. Возможно в среднесрочном периоде, опираясь на исследование временных промежутков, пара может вырасти в район 1,28. Но это скорее всего произойдёт после «перерисовки» последних минимумов и снижения в отметке 1,19.
===================
--EUR/USD Weekly Outlook and Trading Idea Outlook:
--As expected EUR/USD continued lower and almost reached the 1.2145 Fibonacci level (the low recorded last week was 1.2163).
--Now, despite the Friday's bounce, the daily chart remains very negative and I expect further weakness.
--We may see some choppy sideways action first (most likely between 1.2145 and 1.2345) because the market has become quite oversold.
--Only a rise abv 1.2430/40 will negate the immediate bearish outlook and will risk larger recovery twd 1.2670 before the downtrend from the May 2011 top resumes....
--Strategy: Holding short from 1.2600 is favored. Stop=1.2450. [By ibtimes]
1.png
 
Последнее редактирование модератором:

MDunleavy

Активный участник
--Фунт продемонстрировал снижение на "заранее подготовленные позиции" :)Новостей на этой неделе мало, потому рассчитывать на большие амплитуды перемещений не приходится. Состояние 30х3 на 2012-Jul-24 08-10 (GMT+02:00) Athens большая _https://lh5.googleusercontent.com/-5qHbkDgzcz0/UA4yEqWEdYI/AAAAAAAAAYo/6LC_ZBwRC-Q/s895/12Jul24.png
--При размере клетки 30 пунктов и реверсе 3 хорошо виден упор в линию поддержки.
===========================
–Please note that overall GBP/USD has been in a very volatile sideways mode since January 2009.
–A break below 1.5269 and then the low of January 13th i.e.
–1.5233 may indicate a break below the lower support line.
–Please check this weekly chart of GBP/USD.
–Strategies for Trading GBP/USD (British Pound-Dollar): s mentioned above, our overall outlook for GBP/USD stays bearish but initially we stay neutral to expect some volatile sideway moves and even the possibilities of some further upward consolidation can’t be ignored.
–We are avoiding longs for GBP/USD right now, considering the overall bearish outlook.
–As mentioned above, initially we will be watching for the breaks of mentioned resistance and supports for the next week's trade decisions.
– [By forexabode.]
12Jul24.png
 
Последнее редактирование модератором:

MDunleavy

Активный участник
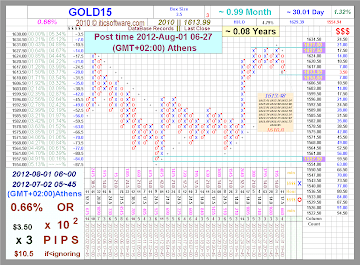
Длительное горизонтальное движение золота предполагает «транспорирование»  горизонтального движения в вертикальное … Т.е. не исключён выход из диапазона. Возможно будет прорыв линии сопротивления и рост цены на золото хотя бы в район 1670 долларов за унцию.
_https://lh4.googleusercontent.com/-A2kgLr-MSgU/UBj7mvuRaGI/AAAAAAAAAaU/IxRJj6xD_Ws/s1129/12Aug01a.png
==============
-GOLD: Although GOLD rallied sharply to close higher the past week, it remains trapped in a range between the 1,544.35 and the 1,640.45 levels.
-In order for the commodity to extend its upside it will have to break and hold above the 1,640.45 level, its range top.
-This if seen will open up further upside towards the 1,670.70 level and then the 1,700.00 level.
-Its weekly RSI is bullish and pointing higher suggesting further strength.
-The alternative scenario will be for the commodity to return to the 1,546.95 level on price failure where a violation will aim at the 1,527.05 level where a breach will resume its broader medium term weakness and then pave the way for further declines towards the 1,500.00 level.
-Price hesitation could occur here but if that level gives way, expect the commodity to decline further towards 1,478.05 level.
-All in all, GOLD continues to hold on to its broader medium term downside though trading in a range[Written by FXTechStrategy]

12Aur01.png
 
Последнее редактирование модератором:
MDunleavy

Активный участник
Австралийский доллар по всей видимости закончил восходящее движение и консолидируется в диапазаоне 1,0575-1,0350. На мой взгляд возможно дальнейшее небольшое снижение к 1,0260-1,0215.
2.png

—The Australian dollar showed some movement in both directions but was almost unchanged over the week, as AUD/USD closed at 1.0399.
—Highlights of the upcoming week include Building Approvals and Private Capital Expenditure.
—The pair continues to trade in a narrow range following mixed economic releases in both the US and Australia, as the pair showed some fluctuation but was unable to sustain any breakout.
—I am neutral on AUD/USD.
—After impressive gains this summer, the aussie has been in a holding pattern for the past few weeks.
—Given the turmoil in Europe and mixed data out of the US and Australia, the choppiness could continue.
—However, if the US economy produces more weak data and there is further talk of QE intervention, look for the Australian dollar to make some gains.[Written by forexcrunch]
 
Последнее редактирование модератором:

MDunleavy

Активный участник
Предполагаю консолидацию евро после сильного восходящего движения.
-----------
–Euro/dollar had a positive week, riding on the determination of the ECB in using its firepower to counter the Spanish crisis.
–The upcoming week is even more important, with the German constitutional court’s ruling needed to enable the bailouts.
–There are quite a few additional regular indicators and special events.
–Will the rally continue?.
–I am neutral on EUR/USD.
–After the huge rally that sent the pair to the highest levels since May, there is room for some correction.
–The rise came on a better than expected ECB decision, and high hopes for QE3 in the US.
–These hopes could lead to a disappointment, countering the big steps that Europe is taking to counter the crisis.
–Written by Forexcrunch.
2-1.png
 
Последнее редактирование модератором:

MDunleavy

Активный участник
–Пара доллар \ франк не смогла преодолеть линию сопротивлениея в районе 0.9400 о чём свидетельствует многочисленные часовые High уровни отражённые в примечании Excel графика.
–Вместе с тем линия поддержки в районе 0.9200 тоже довольно мощная. Потому предполагаю, что во всяком случае в начале недели существенных движений по паре не будет.
3-or8.png
 
Последнее редактирование модератором:
chocolate

Гуру форума
Огромная просьба не добавлять ссылки на непонятные пдф файлы с рекламой и всевозможными призывами кликнуть.

Ссылку можно добавлять на Ваш обновляемый файл на гуглдокс.
Картинки (в том числе и большие) можно загружать к нам на форум. Как это сделать написано тут http://forexsystemsru.com/voprosy-p...avaemye-voprosy-pol`zovatelei.html#post206322
 

MDunleavy

Активный участник
–Если воспользоваться уровнями фибо , то нетяжело заметить, что золото опустилось до уровня 38,2% от последнего роста (1589,2-1795,8).
–Потому либо дальнейшее движение к уровню 50% ~1690.00 либо коррекция до уровня 1740, что мне кажется более вероятным.
–Мне представляется, что фигура, сильно напоминающая расширяющийся треугольник завершена.
–Цена будет рисовать что-то следующее. Тем более 12 дней снижение должно завершиться коррекцией… Смотрите на график, так продолжительно цена давно не снижалась….
-----------------
–Gold Prices Range bound till New Effective Triggers are seen:
–Gold traders now look ahead to next week and movements in gold prices will be taking cues from the FOMC interest rate decision on Wednesday and Q3 GDP data on Friday.
–It is highly unlikely for the Fed to change its QE3 decision in the October 2 day FOMC meeting, which concludes Wednesday.
–Although the central bank is not expected to alter its policy stance, investors will be closely eyeing the accompanying statement for an updated assessment of the domestic economy.
–If the Fed adds concerns about inflation and rising prices, gold prices will remain well supported as investors flock into gold bullion as a traditional hedge against inflationary pressures.
–The Fed may also keep focus on what to do when Operation Twist ends in December.
[Written forexpros]
-----------------
 

Вложения

  • 12Oct22gold.jpg
    12Oct22gold.jpg
    203,2 КБ · Просмотры: 23
  • 12Oct22.zip
    12Oct22.zip
    5 КБ · Просмотры: 14

alexviz

Активный участник
подскажите! поставил новый терминал Альпари, но время показывает терминал на час назад,
 

MDunleavy

Активный участник
подскажите! поставил новый терминал Альпари, но время показывает терминал на час назад,
Если тот терминал, что на картинке, то время будет.
Post time 2012-Oct-22 19-07 (GMT+02:00) Athens оно не меняется в настройках, есть способы получать котировки в времени своего часового пояса, хотя не знаю какой в этом смысл, легче компьютер настроить под часовой пояс Alpari.
 

Вложения

  • 12Oct22_1906.png
    12Oct22_1906.png
    2,1 КБ · Просмотры: 10

MDunleavy

Активный участник
AUD\USD
=======
–Ситуация неопределённая, но определяться нужно :)!
–Если считать что цена строит фигуру восходящего треу4гольника, то можно ожидать прорыва мощной линии сопротивления в районе 1,0440.
–Если дорисуется четвёртый крестик в последнем восходящем движении т.е. цена, скажем, покажет 1,0441 можно будет подумать об открытии длинных позиций с целью 1,0620-1,0665.
–А вообще сильно не верится в рост австралийского доллара, сколько ж ему расти :rolleyes:
–The AUD/USD pair initially fell during the week, but found a bit of a bid later on and formed a hammer.
–This is right after to shooting stars, and is in the middle of a massive consolidation area.
–We figure that this pair will be very difficult to trade, although it does look bullish at the moment.
–As for a longer-term point of view, the Reserve Bank of Australia is slated to cut rates at least once if not twice.
–This should weigh upon the Australian dollar going forward, as well as all the global risks out there.
–However, it appears that as far as longer-term trader concerned, we need to break above the 1.06 level to have complete clarity higher.
–If we managed to break down below the 1.0150 level however, we figure that this pair will absolutely crumble.
[Written by fxempire]
↓↓↓ Click to learn more!↓↓↓
Код:
Expand Collapse Copy
https://docs.google.com/spreadsheet/pub?key=0AhxKzvQ2GlM8dDBqYWl6XzlEbFZDWFVob0FMbG9nbGc&output=html
1.png
 

Вложения

MDunleavy

Активный участник
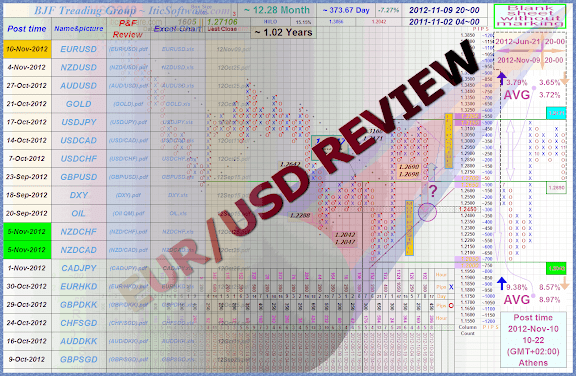
EURUSD Analysis 10th November 2012 – P&F Update...
Скорее всего последует дальнейшее снижение евро.
ru11.png

↓↓↓ Рисунки P&F по паре EURUSD и другим парам (постоянно обновляемые данные) ↓↓↓
Код:
Expand Collapse Copy
https://docs.google.com/spreadsheet/pub?key=0AhxKzvQ2GlM8dDBqYWl6XzlEbFZDWFVob0FMbG9nbGc&output=html
https://docs.google.com/file/d/0BxxKzvQ2GlM8ZmRlMjViOTMtNjAyMS00NzUxLWFjMjEtODk0ZjFlNzg5YzQ5/preview
 

MDunleavy

Активный участник
—Нефть находится в горизонтальном движении, хотя многие рассматривают вариант, что снижение уже закончилось и с этого момента будет рост.
—Я предполагаю, что всё же нефть должна опуститься к отметке 82 доллара, а уж потом перейти в фазу уверенного роста. Спекулянты должны попробовать хотя бы кратковременно снизить цену.
Crude Oil Weekly Technical Outlook
9.png

↓↓↓ Click to learn more! ↓↓↓ (Здесь постоянные обновления.)
Код:
Expand Collapse Copy
https://docs.google.com/spreadsheet/pub?key=0AhxKzvQ2GlM8dDBqYWl6XzlEbFZDWFVob0FMbG9nbGc&output=html
See also
~~~> ht*tps://docs.google.com/file/d/0BxxKzvQ2 GlM8MjZhMjY4ZjAtZTA3 Yi00MTZmLWJhZTQtN2ExODI3 NGUxYzQz/preview
↑↑↑ OR ↓↓↓
~~~> ht*tp://img547.imag eshack.us/im g547/2082/12n ov26.pdf
A d d i t i o n a l l y
 
Последнее редактирование:

MDunleavy

Активный участник
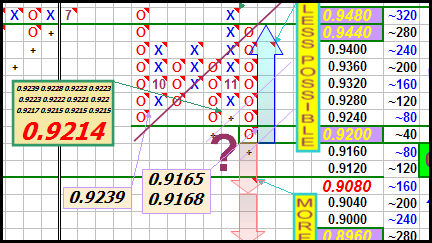
Наверное франк будет иметь в дальнейшем небольшое, как минимум, снижение...
======================
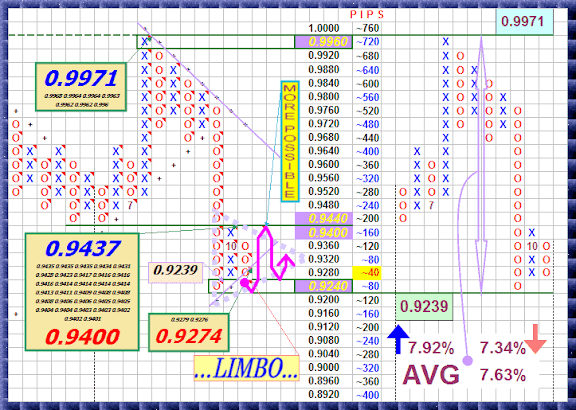
—USDCHF Analysis - December 17, 2012
—USDCHF breaks below 0.9214 support, suggesting that the downtrend from 0.9971 has resumed.
—Further decline could be expected next week, and next target would be at 0.9000 area.
—Resistance levels are at 0.9300 and 0.9400, as long as these levels hold, the downtrend from 0.9511 will continue.
—For long term analysis, USDCHF had formed a cycle top at 0.9971 on weekly chart.
—Further decline to 0.8500 area would likely be seen over the next several months.[Written by ForexCycle]
6_zps58f309ac.png

Click to learn more!~~~> _http://goo.gl/FI6A0
||Expert Advisor||MT Indicator||Forex Software||MQL4 Coding||
 

Вложения

MDunleavy

Активный участник
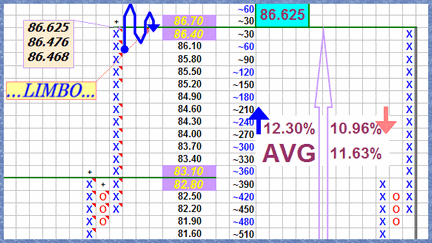
После ралли, ена вероятно будет некоторое время консолидироваться в районе достигнутых максимумов.
======================
USDJPY Analysis - December 29, 2012
—USDJPY's upward movement from 77.14 extends to as high as 86.63.
—Further rise could be expected after consolidation, and next target would be at 88.00 area.
—Support is at 85.50 followed by 84.50, as long as these levels hold, the uptrend will continue.
—For long term analysis, USDJPY had formed a cycle bottom at 77.14 on weekly chart.
—Further rise to 90.00 area is possible over the next several weeks. [ Written by ForexCycle]
12Dec29_zpsbb71bf69.png

Click to learn more! ~~~> _http://goo.gl/YmhM6

||BJF Trading Group||Expert Advisor||MT Indicator||Forex Software||MQL4 Coding||
 

Вложения

Статус
Закрыто для дальнейших ответов.
Верх